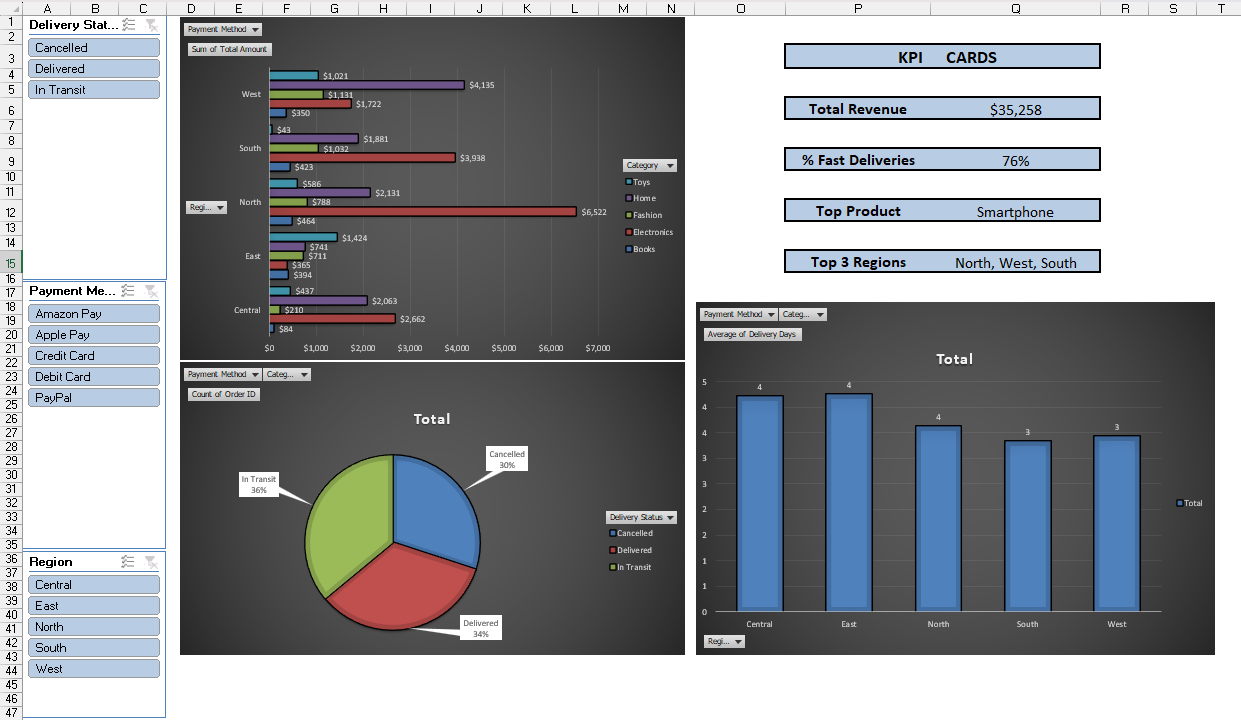
 Featured · dashboard screenshot
E-Commerce Sales & Delivery Intelligence Dashboard
Interactive Excel dashboard for analyzing e-commerce sales performance, delivery metrics, and regional revenue trends.
Why it matters: it shows how a dashboard can turn sales, delivery, and payment data into a single view for faster business decisions.
Track revenue, delivery status, and regional performance in one place instead of reviewing separate reports.
Microsoft Excel, pivot tables, charts, slicers, KPI cards, and data cleaning.
Prepared the data, built interactive filters, and organized the dashboard around fast scanning and comparison.
Created a dashboard with revenue, delivery, and product insights, including KPI cards for $35,258 revenue, 76% fast deliveries, and top product tracking.